Figure 2.
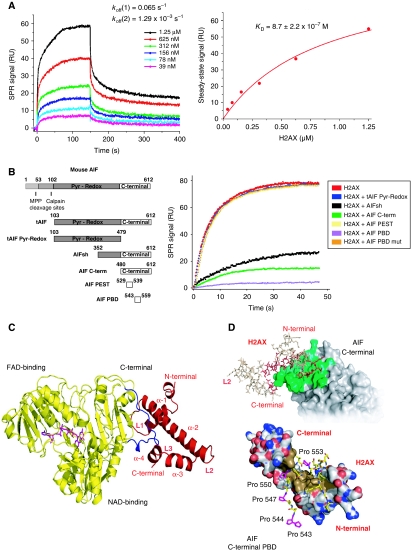
AIF interacts with H2AX through its C-terminal PBD. (A) SPR sensorgrams resulting from the injection of the indicated concentrations of soluble H2AX onto immobilized tAIF. koff, dissociation rate constants. Right: H2AX concentration dependence of the steady-state response. KD, equilibrium dissociation constant. (B) Mouse AIF, tAIF, tAIF Pyr-Redox, AIFsh, AIF C-term, AIF PEST, and AIF PBD protein organization (Left). Numbers designate aminoacids. Pyr-Redox and C-terminal AIF domains are indicated. Right: SPR sensorgrams showing the association of H2AX with immobilized tAIF, in the absence or presence of tAIF Pyr-Redox, AIFsh, AIF C-term, AIF PEST, AIF PBD, or AIF PBD mut. (C) Model of the tAIF/H2AX complex obtained by homology with the known crystal structures of the individual partners. Left: ribbon structure of tAIF (yellow) and H2AX (red). AIF interacts with H2AX through its C-terminal residues 543–559 (in blue). FAD (the AIF cofactor) is drawn in magenta. H2AX folding consists of four α helices (α-1 to α-4) linked by three short loops (L1–L3). (D) tAIF/H2AX molecular docking. Upper: surface of the tAIF binding interface (green). Residues of H2AX interacting with tAIF surface are drawn in red. Lower: tAIF C-terminal proline-rich residues interact with H2AX through a hydrophobic cluster (brown). Acidic and basic residues are, respectively, depicted in red and blue. AIF C-terminal Pro543, 544, 547, 550, and 553 are drawn in magenta.

