Figure 4.
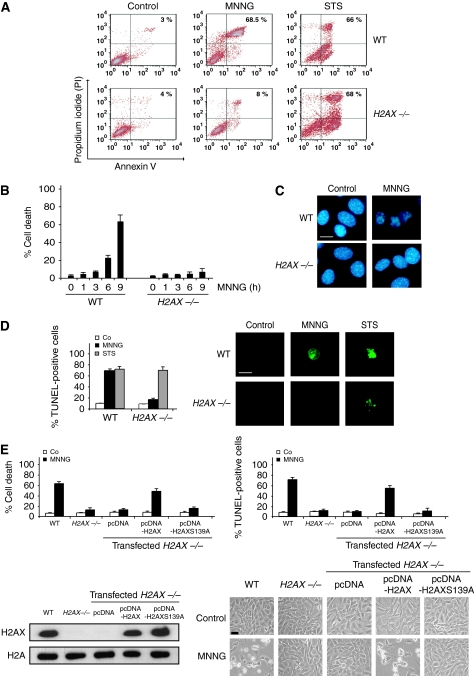
γH2AX is essential for programmed necrosis. (A) WT and H2AX−/− cells were untreated (control) or treated with MNNG (9 h) or staurosporine (STS), labelled with AnnexinV-FITC and PI, and analysed by flow cytometry. Representative cytofluorometric plots are shown. Percentages refer to double-positive staining. (B) Kinetic analysis of PS exposure and cell viability loss induced by MNNG in WT and H2AX−/− MEFs. After the indicated times, cells were stained as in (A) and the frequency of double-positive labelling was recorded and expressed as a percentage. Data are the means of 10 independent experiments±s.d. (C) WT and H2AX−/− MEFs were treated with MNNG (9 h) and stained with Hoechst 33342 to visualize nuclei. Representative nuclei from untreated (control) or MNNG-treated cells are shown. Bar: 10 μm. (D) WT and H2AX−/− MEFs were untreated (Co) or treated with MNNG (9 h) or STS as in (A), stained for the detection of 3′-OH DNA breaks, and analysed by flow cytometry. Data are the means of six independent experiments±s.d. Right: representative microphotographs from each treatment are shown. Bar: 10 μm. (E) H2AX−/− MEFs were transfected with the indicated expression plasmids and selected as described in ‘Materials and methods' section. Then, cells were untreated (Co) or treated with MNNG (9 h). Cell death was analysed by AnnexinV-FITC/PI and TUNEL staining. Data are means±s.d. (n=8). The expression level of H2AX was assessed by immunoblotting. Equal loading was confirmed by histone H2A assessment. Representative microphotographs of each treatment are shown. Bar: 40 μm. A full-colour version of this figure is available at The EMBO Journal Online.

