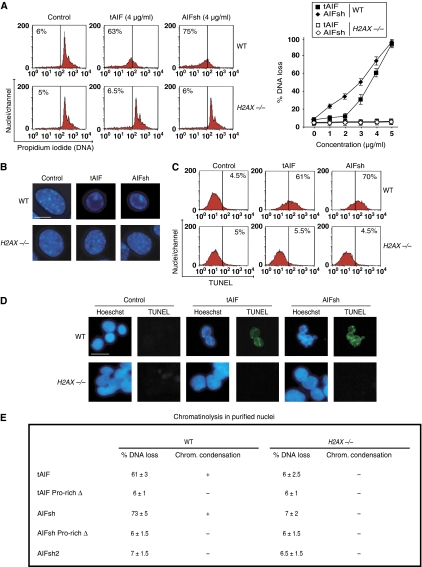
Figure 7.
Cooperative effect of AIF and H2AX on chromatinolysis. (A) Purified WT and H2AX−/− MEFs nuclei were incubated in the absence (control) or presence of mouse recombinant proteins tAIF and AIFsh and stained with PI. The percentage of DNA loss was measured by flow cytometry and illustrated as a plot. Data are shown as mean values±s.d. (n=4). In cytometry panels, numbers indicate the % of hypoploid nuclei. (B) WT and H2AX−/− MEFs nuclei were treated with tAIF and AIFsh (4 μg/ml) and stained with Hoescht 33342 to visualize chromatin condensation by fluorescent microscopy. Representative micrographs of each treatment are shown. This experiment was done three times, yielding similar results. (C) Nuclei were treated with tAIF and AIFsh as in (B), stained for the detection of 3′-OH DNA breaks, and analysed by flow cytometry. Representative cytofluorometric plots are shown. (D) In a similar experiment to (C), nuclei were stained with Hoechst 33342, and blue and green (TUNEL positive) fluorescence was visualized. Representative microphotographs from untreated (control), tAIF, or AIFsh-treated nuclei are shown. Bar: 20 μm. (E) Table compiling the results obtained in WT and H2AX−/− MEFs nuclei incubated in the presence of tAIF, tAIF Pro-rich Δ, AIFsh, AIFsh Pro-rich Δ, and AIFsh2 (4 μg/ml). Data are represented as % of DNA loss measured as in (A) (X±s.d.; n=5), +: induction of chromatin condensation, or −: absence of chromatin condensation. A full-colour version of this figure is available at The EMBO Journal Online.

