Figure 2.
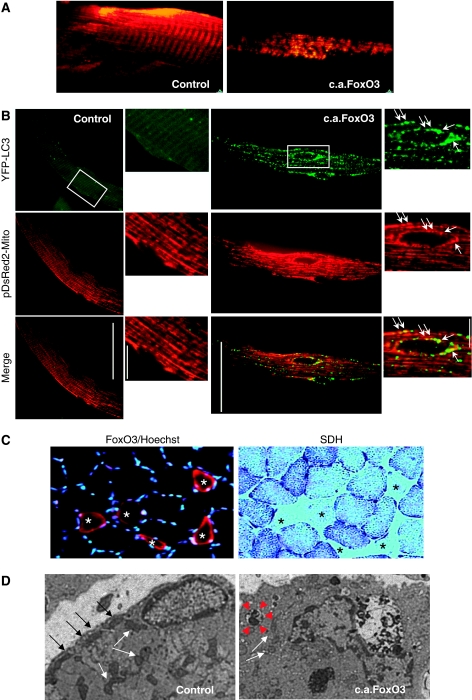
FoxO3 controls mitochondrial network. (A) Imaging of FoxO3-mediated modification of the mitochondrial network in soleus muscle of living mice. Adult soleus muscles were transfected with pDsRed2-Mito and either c.a.FoxO3 or mock vector (control). Two weeks later, muscles were exposed and observed in situ using two-photon microscopy. At least five animals per condition were studied. (B) Overexpression of c.a.FoxO3 induces mitochondrial changes and removal through autophagy. Muscle fibres were transfected by electroporation with YFP-LC3, pDsRed2-Mito and either c.a.FoxO3 or mock vector. Two weeks later, fluorescent fibres were analysed for mitochondrial distribution by confocal microscopy. A higher magnification of the square is depicted on the right panels. White arrows point autophagosomes engulfing the mitochondria. (C) Overexpression of c.a.FoxO3 induces reduction in myofibre size and decrease in SDH staining. Left image: immunostaining for FoxO3 shows atrophic fibres, which over-expressed FoxO3 (red) and are labelled by asterisks. Nuclei are stained by Hoechst (blue). Right image: histochemistry for succinate dehydrogenase (SDH) on serial section. Note that fibres positive for FoxO3 are negative for SDH staining (asterisks). (D) Electron micrograph of a control and c.a.FoxO3-expressing fibres. Muscles were processed with standard fixation-embedding procedure. Black and white arrows indicate subsarcolemmal and intermyofibrillar mitochondria, respectively. Note that subsarcolemmal mitochondria are reduced in FoxO3 overexpressing fibres, whereas intermyofibrillar mitochondria are smaller and paler than control ones. Red arrowheads show a vesicle containing mitochondria. The image is representative of the FoxO3-transfected fibres.

