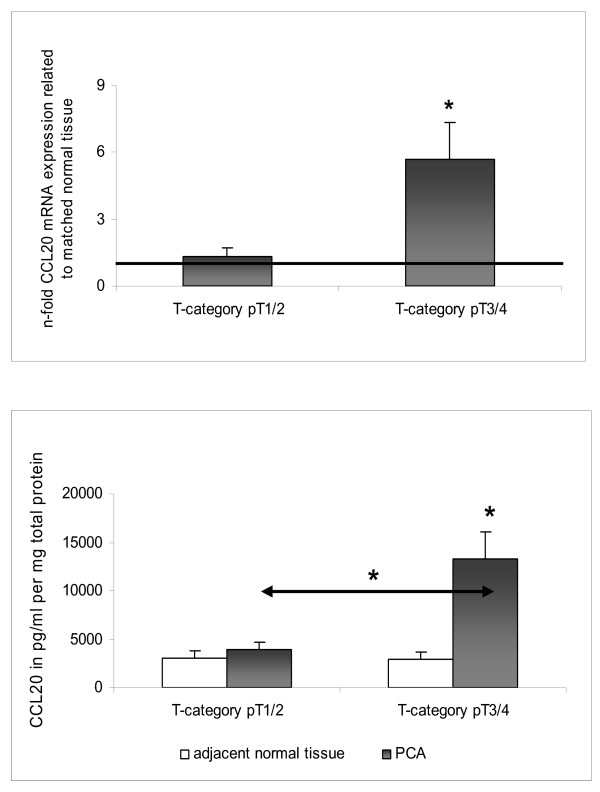
Figure 4.
Expression of CCL20 in different tumor categories of PCA as determined by [A] Q-RT-PCR and [B] ELISA. mRNA and protein expression profiles of CCL20 (pg/ml pro mg total protein) were measured in PCA tissues and matched normal tissues in pT1 + pT2 (n = 11) (A) and pT3 + pT4 (n = 14) (B), respectively. For Q-RT-PCR data fold increase above 1 indicates CCL20 up-regulation in PCA compared to normal tissues. All data are expressed as mean ± SEM, * p < 0.05

