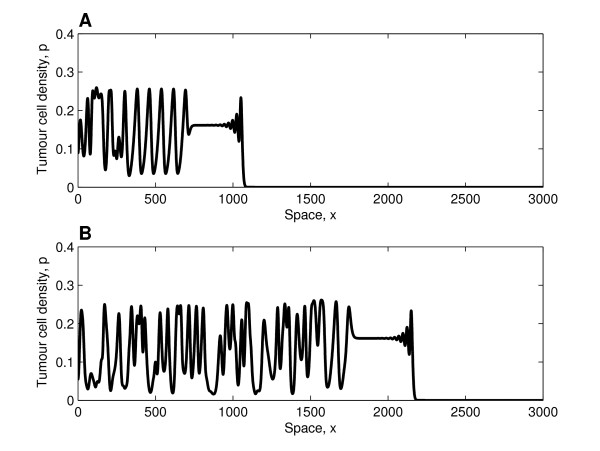
Figure 5.
Solution profiles in the case of unstable wave trains. Series of profiles (solutions of equations (25)-(26)) showing how the tumour cell density evolves when irregular waves develop behind the invading tumour front (similar profiles of the vessel density not presented). Panel A (B) depicts the behaviour at t = 2000 (t = 4000). Behind the invading front, which travels with constant shape and connects the tumour-free steady state with the unstable co-existence steady state ((p, v) = (0.16, 0.3)), irregular spatio-temporal oscillations develop. Parameter values: η0 = 0.5, dp = 0.6, ds = 0.2,  = 0.2761 (using (A-11) in the Appendix (additional file 1)), δ = 1.0, Dv = 1, sβ = 0.4 and σp = 0. For these parameter values the waves are unstable (see Figure 3). For the numerical simulations we fix Δx = 1/3 and L = 3500, with (p(0, 0), v(0, 0)) = (0.01, 1) and (p(x, 0), v(x, 0)) = (0, 1) for x: 0 <x ≤ 1.

