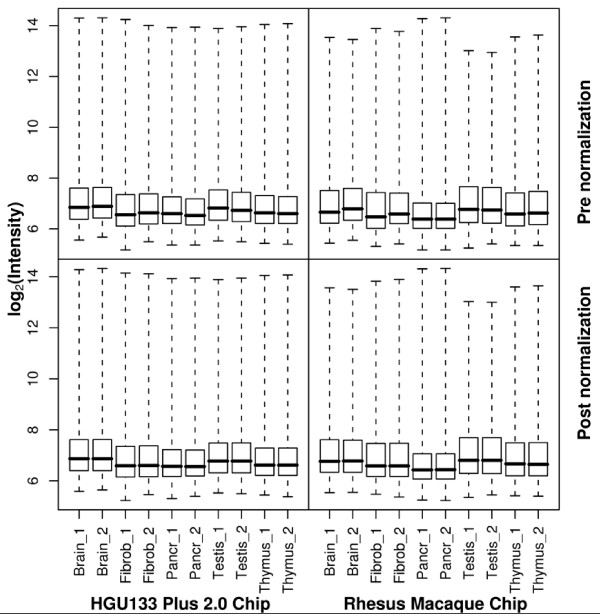
Figure 1.
Probe-level log intensities for 10 HGU133 plus 2.0 Microarrays and 10 rhesus macaque Microarrays. Each tissue type was hybridized with two human and two rhesus GeneChips. The two upper plots were generated from raw data (before normalization) and the two lower plots were generated from data after quantile normalization was performed.

