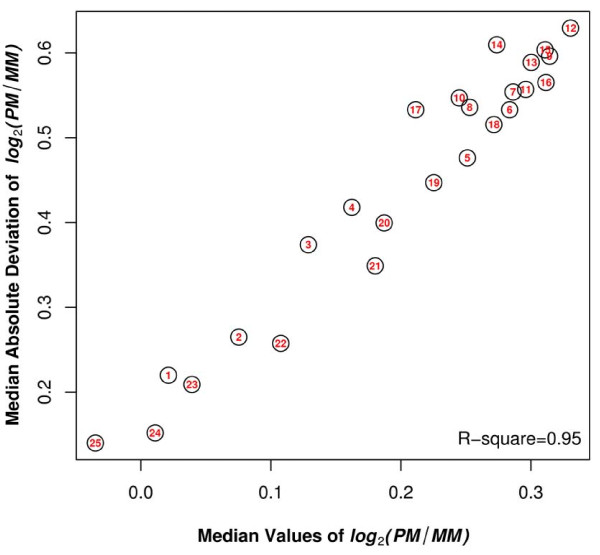
Figure 3.
Average of log2(PM/MMi) versus the variability of log2(PM/MMi) across 25 mismatch positions. The values of the median and the median absolute deviation (MAD) of log2(PM/MMi), representing the robust versions of the average and variability, were calculated for each mismatch position. The number inside the circle indicates the mismatch position. R- square measures the strength of the linear relationship between two variables.

