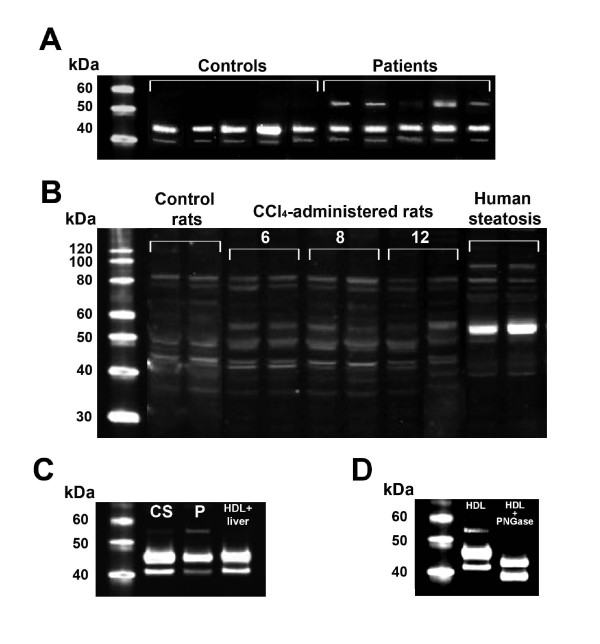
Figure 4.
(A) Western blot analysis of HDL particles in control subjects and patients with liver cirrhosis. HDL from the patients had an immunoreactive band (very light in the case #3) of about 55 kDa. (B) Western blot analysis of liver homogenates from control rats, CCl4-administered rats over a period of 6, 8 and 12 weeks, and liver biopsy samples from human patients with liver steatosis. A band at the relative molecular weight of 55 kDa increased progressively over the time-course of CCl4 administration. A similar, very intense band was observed in patients with steatosis. (C) Western blot analysis of HDL particles from a control subject (CS), a patient with cirrhosis (P), and normal HDL incubated in vitro with a liver homogenate from a patient with steatosis. (D) Western blot analysis of HDL particles from a patient with liver cirrhosis, with and without pre-incubated with PNGase F.

