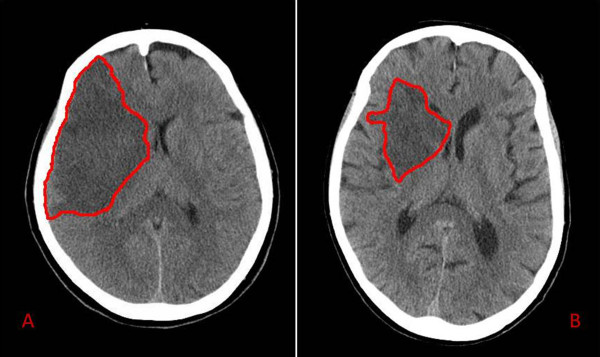
Figure 1.
Follow-up brain CT scans of two stroke patients. Two examples of CT scans of two stroke patients at 48 hours since admission. The red outline circumscribes the ischemic area. The patient in panel A had a total occlusion of right middle cerebral artery, presenting with left hemiparesis and hemianopia (Female; Age = 80 yrs.; T0 AEA = 7.31 pmol/lipid mg; T0 NIHSS = 17; T0 aFMS score = 12). The patient in panel B was admitted for a left hemiparesis due to a partial occlusion in right middle cerebral artery territory (Female, Age = 82 yrs.; T0 AEA = 3.93 pmol/lipid mg; T0 NIHSS = 10; T0 aFMS score = 18).

