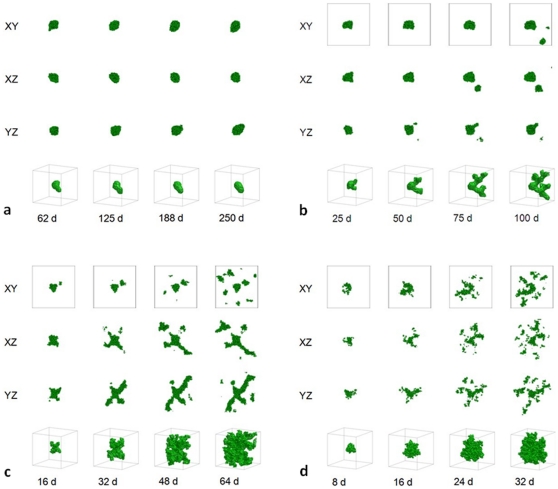
Figure 4. Simulated growing tumors with  .
.
(a)  . 2D sections of a 3D simulation along the XY plane. The developing tumor remains compact and ceases proliferating. We do not show 2D sections along the XZ and YZ planes because they are essentially indistinguishable from those along the XY plane. We do not show 3D visualization of the same simulation because it does not provide any new information about the simulated tumor. (b)
  . 2D sections of a 3D simulation along the XY (first row), XZ (second row) and YZ plane (third row). The developing tumor forms a truncated dendrite. The disconnected parts in the last image connect to the backbone of the tumor out of the section plate. Fourth row: 3D visualization of the same simulation. (c)
  . 2D sections of a 3D simulation along the XY (first row), XZ (second row) and YZ plane (third row). The developing tumor has a form intermediate between dendrite and seaweed, with thinner fingers. The disconnected parts in the images connect to the backbone of the tumor out of the section plate. Fourth row: 3D visualization of the same simulation. (d)
  . 2D sections of a 3D simulation along the XY (first row), XZ (second row) and YZ plane (third row). The developing tumor forms a seaweed. The disconnected parts in the images connect to the backbone of the tumor out of the section plate. Fourth row: 3D visualization of the same simulation. The simulation time is indicated in days beneath each column, where 1 day = 400 MCS.

