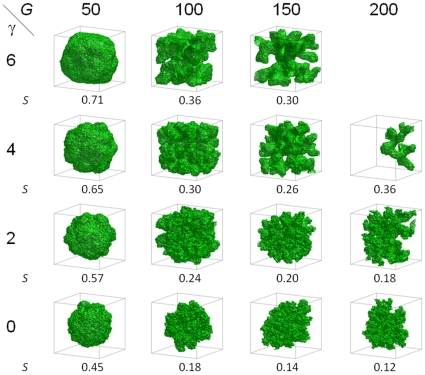
Figure 5. Morphologies of 3D tumors visualized in 3D and sphericity  as a function of
  and
and  , observed when the simulated tumor reaches the boundaries of the simulation domain (
 6 mm).
The standard deviation for  is less than 0.02. The panel for
  and
and  is blank because the corresponding tumor never grows to this size.

