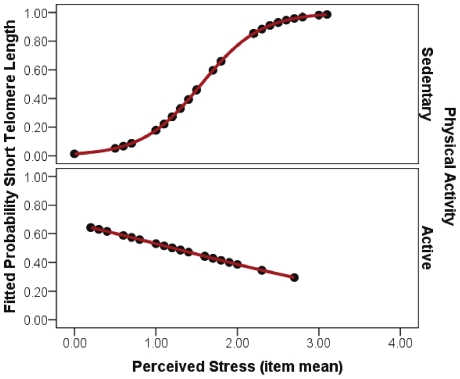
Figure 1. Fitted Probability of short telomeres as a function of perceived stress for sedentary and active individuals.
Note. Physical activity categories are based on whether the participant met CDC recommended levels of exercise per week. Perceived stress ratings are based on the Perceived Stress Scale. The interaction effect was significant (p<.05), indicating that the relationship between perceived stress and telomere length was significant in inactive participants only. The Y axis probability presents the probability of categorization into short telomere length (bottom tertile) as a function of perceived stress in inactive (top of figure) versus active (bottom of figure) participants. Probability scores were calculated from the fitted regression equations, assuming mean BMI and education level.

