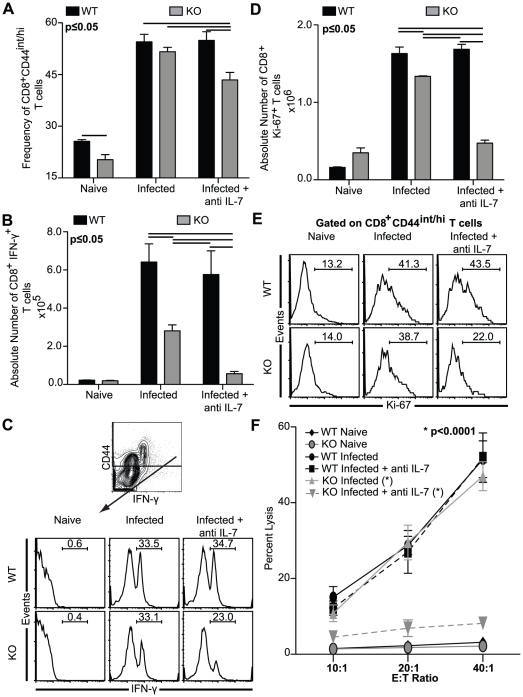
Figure 1. Impaired CD8+ T cell response in anti IL-7 treated KO mice.
Splenocytes were harvested from WT, KO, anti IL-7 treated WT and anti IL-7 treated KO mice at day 14 p.i. A, Percentage of CD44int/hi cells in the CD8+ T cell population depicted as bar graph was enumerated by surface staining the splenocytes for CD8β and CD44. B–C, For IFNγ production, cells were stimulated in vitro with TLA and after overnight incubation stained for CD8β, CD44 and IFN-γ as described in Materials and Methods . Data are presented as absolute number of IFN-γ producing CD8+ T cells (B) or as frequency of CD8+CD44int/hi cells expressing IFN-γ (C). C, The CD44 vs. IFN-γ plot in the top panel is gated on CD8+ T cells. D–E, For evaluation of cycling CD8+ T cells, splenocytes were stained for CD8β, CD44, and Ki-67. Data are presented as absolute number of CD8+Ki-67+ T cells (D) or as histograms gated on CD8+CD44int/hi T cells (E). F, CTL assay was performed with purified splenic CD8+ T cells cultured in presence of TLA and irradiated feeder cells. Following incubation with 51Cr labeled infected targets at various E:T ratios, radioisotope release was assayed. The data depicted here represents at least 2 experiments with 3–4 mice per group.

