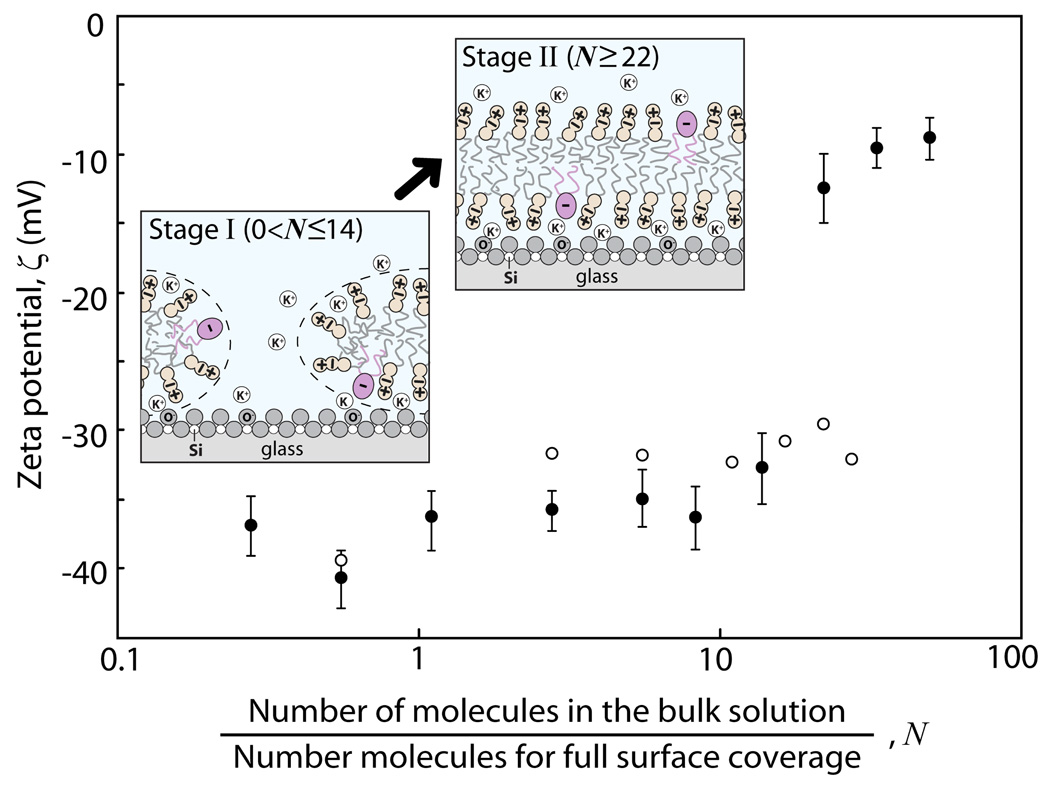
Figure 4.
Plot of ζ-potential values of the DMPC membrane-covered borosilicate surfaces as a function of N and in 100 mM KCl solution at room temperature. The different colored data points represent two independent experiments conducted under the same conditions but different injection ways: The black points represent the experiments where, for N>10, N was increased in larger increments than the open circles. The two different experimental results suggest that the amount of lipid molecules added during a single injection as opposed to the same total amount added through multiple injections affects the dynamics of SLB formation. Fluorescence images and FRAP experimental data shown in Fig. 3, Fig. 5, and Fig. 6 were obtained simultaneously while measuring the ζ-potential values, shown as the black solid data points here. The first schematic in Figure 4 shows that bilayer patches form from vesicles on the negatively charged glass which is still partially exposed to the buffer solution (Stage I where the vesicle concentration in solution, Cvesicle, was varied between 0.001 and 0.05 mg/ml). The second schematic shows the glass surface fully covered by a continuous SLB but the K+ counterions trapped between the glass and the bilayer do not completely balance with the negative charges on the surface resulting in a “non zero” ζ-potential (Stage II where Cvesicle was varied between 0.08 and 0.1 mg/ml).

