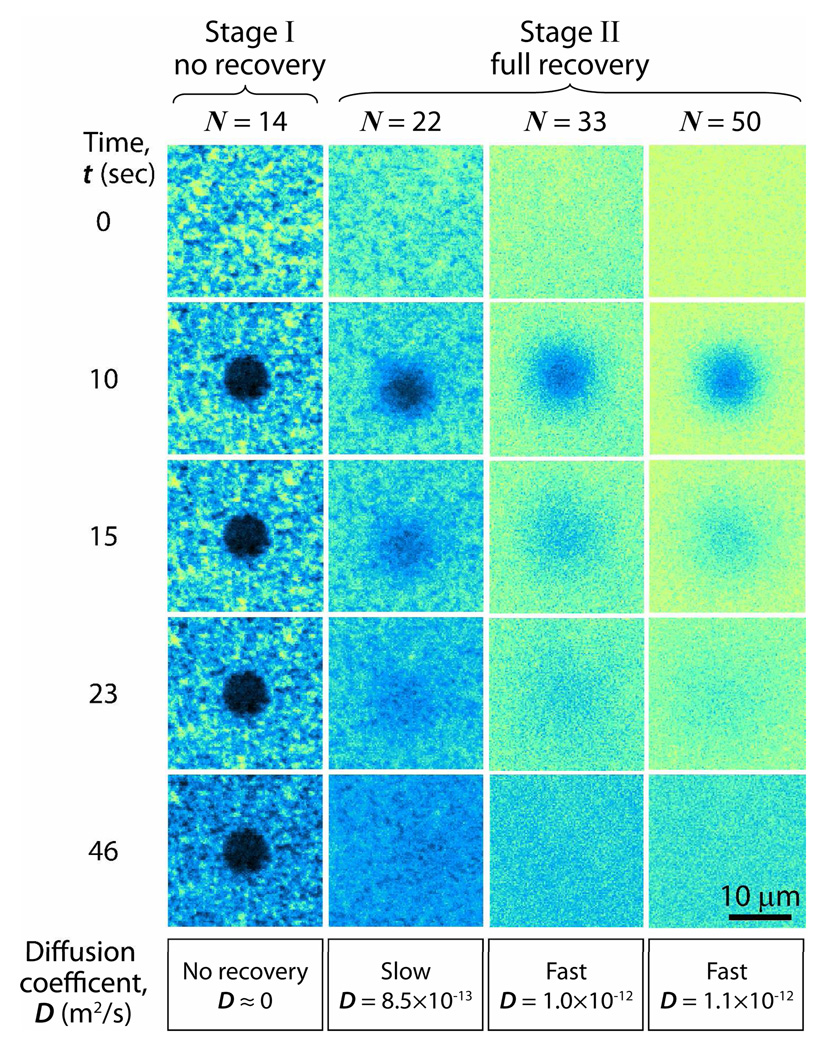
Figure 5.
FRAP images at four different DMPC vesicle concentrations, each containing 1 wt % of the fluorescent dye lipid TR-DHPE. At vesicle concentrations below N=14 (Stage I) there is no recovery within 5 min, indicating that continuous bilayers do not develop on the surfaces, or do so only very slowly. In contrast, for N≥22 (Stage II) there is rapid recovery after photobleaching (last three columns). The errors associated with various aspects of the experiments and analyses on D are estimated as ~2 %. The diameter of each photobleached circle is 7.5 µm.

