
Figure 1.
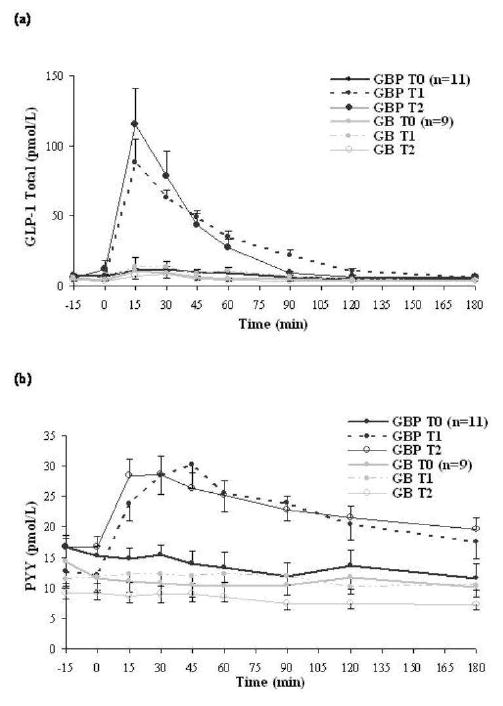
Mean post-prandial GLP-1 (a) and PYY (b) levels at T0, T1, and T2 after GBP or GB. Data are present as mean ± S.E.M. GLP-1, Glucagon-like peptide-1; PYY, peptide YY; T0, baseline; T1, at equivalent weight loss (12 kg) between surgical groups; T2, at one year post-surgery; GBP, gastric bypass; GB, gastric banding.