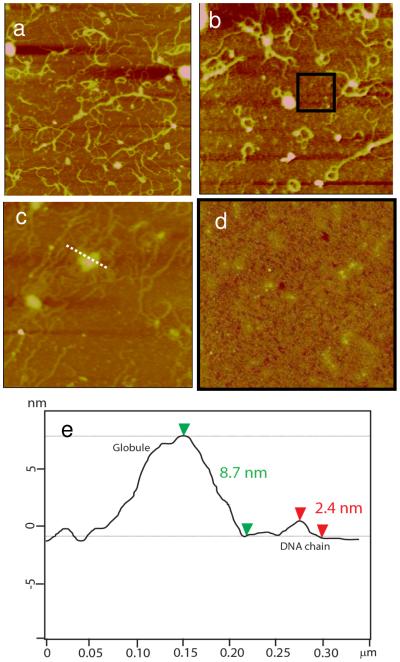
Figure 10.
Time-lapse AFM images of the RHB/DNA/polyplex film in 20 mM DTT and 0.4 M NaCl. a) 2 h (Rq= 1.43 nm). b) 4 h (Rq= 1.55 nm). c) 6 h (Rq= 1.30 nm). The scan size for (a) and (b) is 4 μm and for (c) is 1.5 μm. The z-range is 15 nm. d) Background of (b) scanned at 0.8×0.8 μm2 (Rq=1.23 nm). e) The cross-sectional height profile of (c) along the dashed line.

