Figure 3.
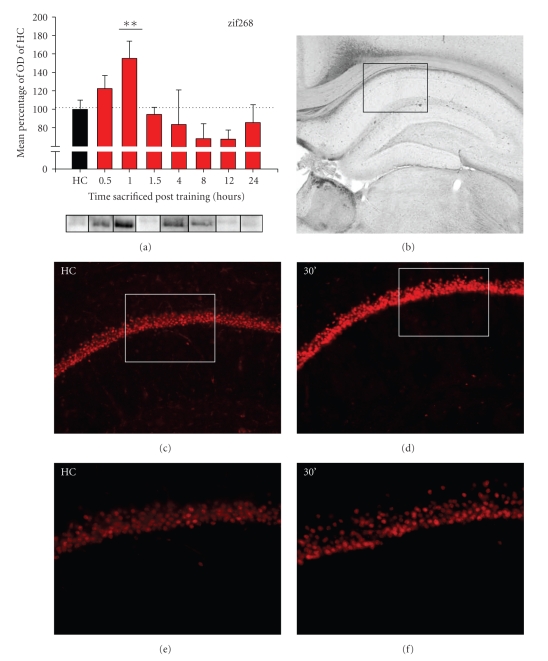
Expression of zif268 protein in the dorsal hippocampus following fear conditioning. (a) zif268 protein expression exhibits a noticeable increase at 30–60 min post-training. Statistical analysis revealed that protein levels are not different from HC after 60 min. Bar graph represents the group means + SEM. Representative western blot images are presented for each group directly below the corresponding graph. Significant differences from HC controls are denoted with asterisks: *P < .05, **P < .01. (b) Brightfield photomicrograph (2x magnification) of the dorsal hippocampus. The boxed area indicates the region of CA1 depicted in the immunofluorescence images of (c) and (d) (10x magnification). (c) Basal expression of zif268 protein in the CA1 of home cage animal. (d) zif268 protein expression is increased in CA1 neurons 30 min after fear conditioning. (e), (f) Higher magnification photomicrographs (20x magnification) of the boxed regions from (c) and (d), respectively.

