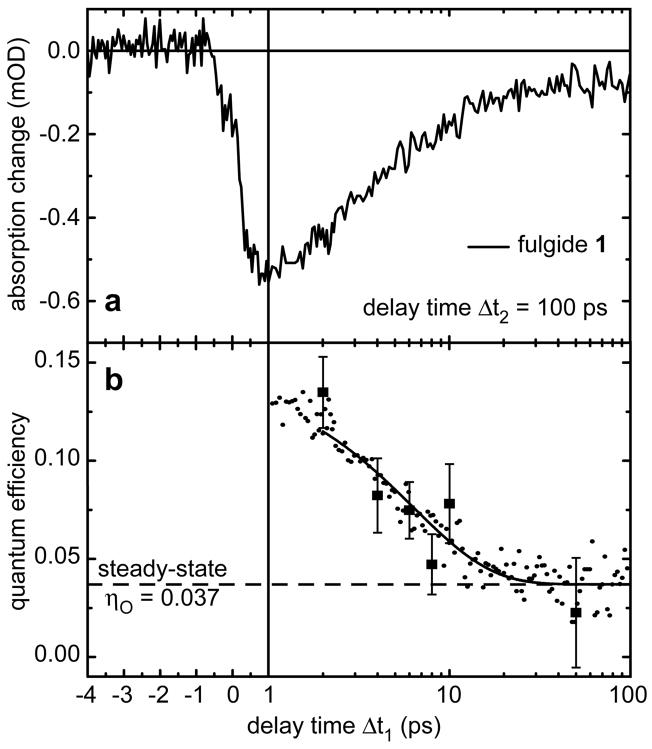
Figure 2.
(a) Transient absorption change of fulgide 1 detected at 547 nm and recorded at fixed time delay Δt2 = 100 ps between excitation and probe pulse on a linear-logarithmic scale. The signal is plotted against the time delay Δt1 between pre-excitation and excitation pulse. (b) Quantum efficiency after pre-excitation of fulgide 1. The dashed line indicates the steady-state quantum efficiency ηO = 3.7% at 302 K. The squares are the values taken from [21]. Dots are the measured values deduced from Figure 2a. Both measurements agree very well. The line is the fit of Figure 3. For short delay times Δt1 a strong improvement of the quantum efficiency is found compared to the steady-state value.

