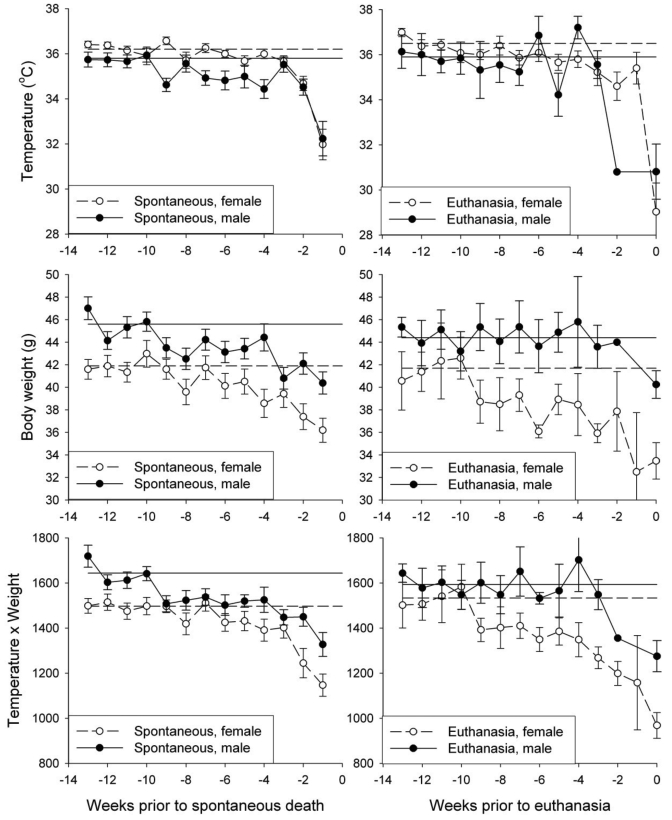
Figure 2.
Temperature, body weight, and the temperature × weight in the final 13 wk of life. Values of temperature and body weight were aligned with respect to the time of collection prior to spontaneous death or euthanasia and are plotted in order of collection prior to death. Horizontal lines represent the average of all values collected during weeks 10 to 13 prior to death for all mice in that group.

