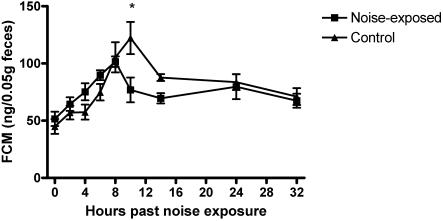
Figure 2.
Mean fecal corticosterone metabolite concentrations in mice exposed to vacuum-cleaner noise and in control mice. Significant (P < 0.01) differences between groups are marked with asterisks. Error bars represent standard error. Significant sources of variation include time (P < 0.0001) and noise exposure × time (P = 0.0114).

