
Figure 6.
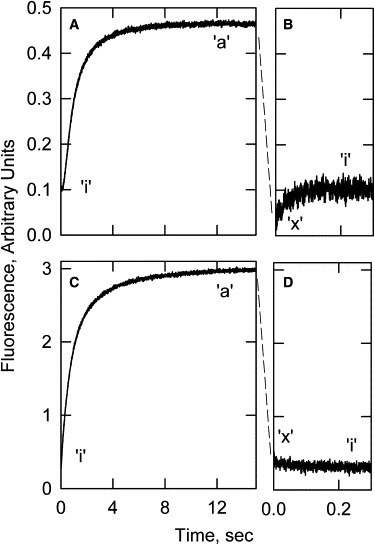
Fluorescence changes for formation of the active state from the inactive state compared with those observed in going from the active state to the inactive state. (A) Acrylodan-tropomyosin transition observed after mixing actin-troponin-tropomyosin with S1. (B) Acrylodan-tropomyosin transition observed after chasing S1 off S1-regulated actin with ATP. The decrease in fluorescence expected from A to B was too fast to measure. (C) Pyrene-tropomyosin transition observed after mixing actin-troponin-tropomyosin with S1. (D) Pyrene-tropomyosin transition observed after chasing S1 off S1-regulated actin with ATP. The major state present in each part of the curve is given as a for active, x for intermediate, and i for inactive. Conditions as in Fig. 1 but at 24.4°C.