
Figure 5.
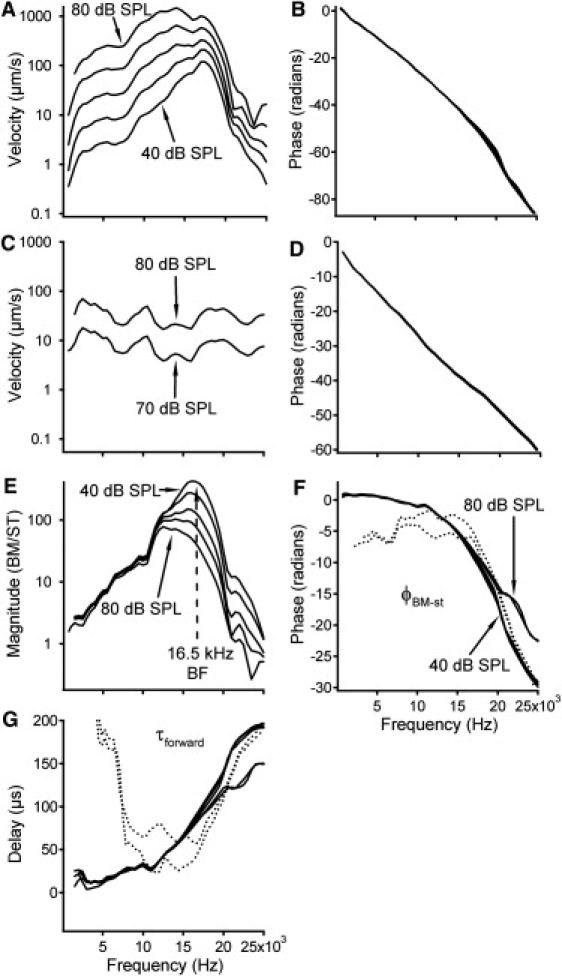
Forward propagation of BM vibration. (A and B) BM magnitude and phase responses. Panel A shows a sharp response peak at ∼16.5 kHz at 40 dB SPL, which broadens and shifts toward low frequencies as sound level increases. Phase progressively decreases with frequency (B). (C and D) Stapes magnitude and phase responses. (E) The forward magnitude transfer function shows a sharp peak response at low stimulus levels. The peak shifts toward low frequencies and the magnitude decreases with the sound level. (F) Phase slope decreases with frequency, indicating that the wave slows at high frequencies. This is confirmed by delays in panel G. Dotted lines in panels F and G are DP data collected at 70- and 80-dB SPL stimulus levels.