
Figure 3.
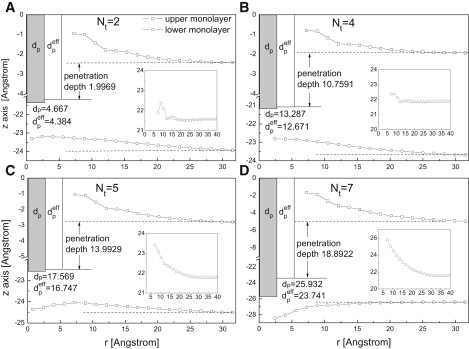
The locations for the upper and lower monolayer as a function of the distance from the center of proteins. Insets show the thickness of the membrane. Shaded area represents the measured protein hydrophobic length dp, and open area represents the effective protein hydrophobic length . The penetration depths of different proteins are also shown in the figures. The zero point of the perpendicular axis represents the highest point of the protein hydrophobic parts.