
Figure 2.
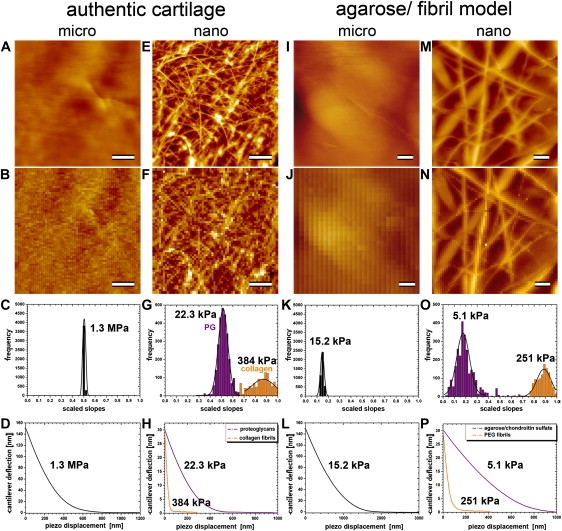
Images and IT-AFM measurements of stiffness of articular cartilage and a PEGT/PBT-fibril/agarose/chondroitin sulfate gel composite at the micro- and nanometer scales. Images and force maps on cartilage are scaled to a height of 400 nm, whereas images and force maps on the model material are scaled to a height of 2000 nm. All scale bars correspond to 2 μm. (A–D, first column) Micrometer-scale information for cartilage. (A and B) The corresponding nanometer scale data. (C) Distribution of raw stiffness values (scaled slopes) obtained from the IT-AFM force/displacement curves. (D) Distribution of force curves and the value of E∗. (E–H, second column) Analogous information obtained at the nanometer scale. The third and fourth columns show analogous images and data for the model material.