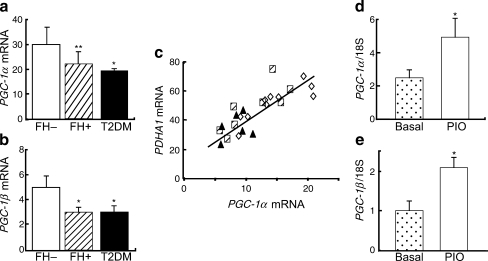
Fig. 10.
PGC-1α and PGC-1β expression in muscle of (a, b) individuals with normal-glucose-tolerance and without family history (FH−) of diabetes, insulin-resistant normal-glucose-tolerant offspring of two type 2 diabetic parents (FH+) and participants with type 2 diabetes mellitus (T2DM). c A strong linear relationship exists between PGC-1α mRNA and PDHA1 mRNA, and the expression of other mitochondrial genes (not shown) involved in oxidative phosphorylation. White diamonds, FH−; black triangles, type 2 diabetes mellitus; hatched squares, FH+. d, e Pioglitazone (PIO) treatment of type 2 diabetic patients significantly increased the expression of PGC-1α and PGC-1β mRNA in muscle. *p < 0.05 for FH + vs FH−; **p < 0.01 for FH+ and T2DM vs FH−, and (d, e) *p < 0.05 for PIO vs Basal. Figure adapted with permission from Patti et al. [182] and Coletta et al. [175]

