
Figure 1.
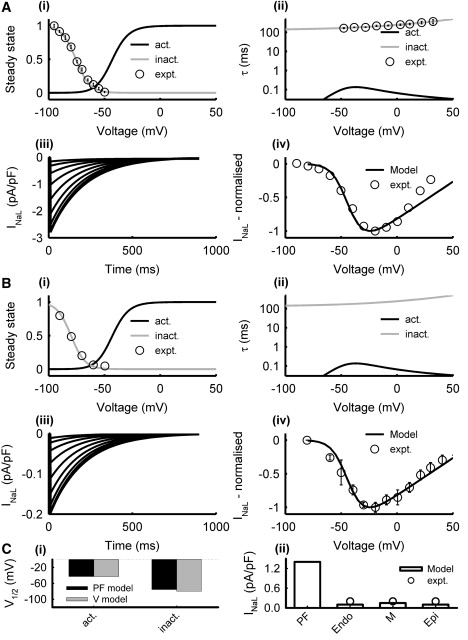
Model of INaL in PF (A) and ventricular (B) cells. Simulation results (lines) and respective experimental data (symbols) from PF (21) and ventricular (22) cells: (i) steady-state activation (black) and inactivation (gray) curves, (ii) activation and inactivation time constants, (iii) current traces generated during 1000 ms voltage-clamp pulses from the holding potential of −90 mV to 50 mV in steps of 10 mV, (iv) normalized I/V relationships. (C) Characteristics of the PF and ventricular cell models: (i) half activation and inactivation voltages, and (ii) simulated peak current densities as compared with experimental data (20). Here and below, V = ventricular cell.