
Figure 3.
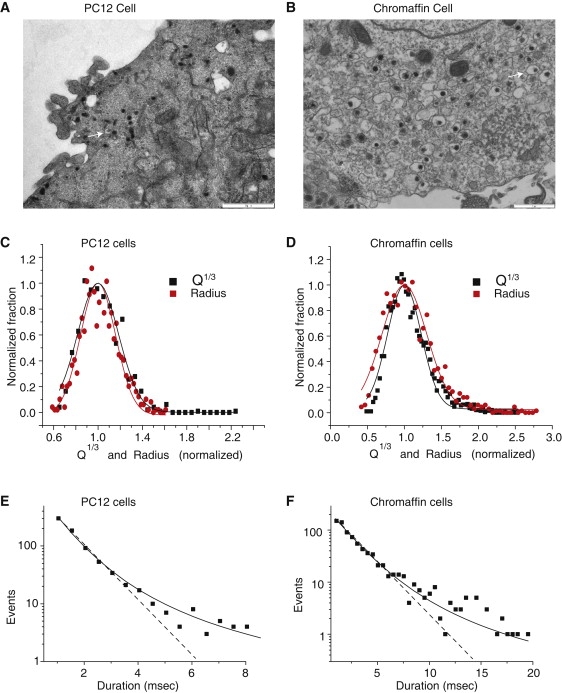
Electron micrographs of (A) PC12 cells and (B) chromaffin cells show dense-core vesicles (white arrows; scale bar = 1 μm). Distributions of Q1/3 from amperometry and vesicle radius (Rv) from electron microscopy, for (C) PC12 cells and (D) chromaffin cells. The distributions were normalized to the values at the peak (x coordinate) and maximum (y coordinate) of the fitted Gaussian. Gaussian fits gave means and standard deviations of 45.3 nm and 20.3 nm (Rv, PC12 cells); 3.53 fC1/3 and 1.84 fC1/3 (Q1/3, PC12 cells); 101.4 nm and 86.7 nm (Rv, chromaffin cells); 6.74 fC1/3 and 4.33 fC1/3 (Q1/3, chromaffin cells). Standard errors never exceeded 5% of the means. For diameters, 895 vesicles for PC12 cells and 1057 vesicles for chromaffin cells; for Q1/3 the data sets were from Fig. 1. Distributions of τ deviated from a single exponential for (E) PC12 cells and (F) chromaffin cells. The dotted line shows the exponential fit, and the solid curve shows the fit of Eq. 4 with Q01/3 and S0 fixed at the values from the fits in C and D, and β taken from the fits in Fig. 1, B3 and C3. The fits yielded α values of −1.71 ms−1 and −0.56 ms−1 for PC12 cells and chromaffin cells, respectively.