
Figure 4.
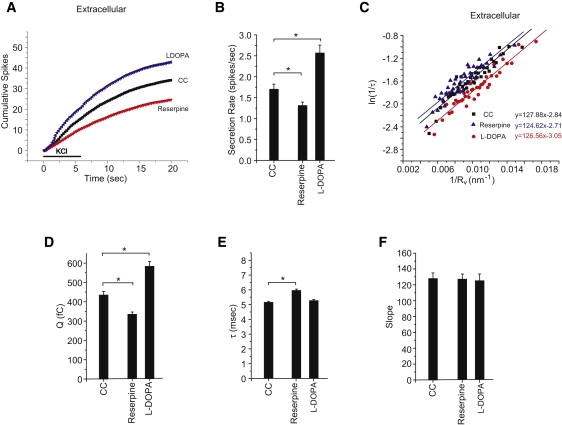
Vesicle size and exocytosis. (A) Cumulative spike-count time course in control chromaffin cells and cells treated with 100 nM reserpine or 100 μM L-DOPA (90 min each). Bar indicates depolarization with high KCl. (B) Secretion rates (spikes per cell in the first 20 s) from A. (C) ln(1/τ) versus 1/Rv plots. Q1/3 was converted to Rv using the scaling parameters from fits in Fig. 3D. Best fitting lines were drawn and stated in the corresponding color. (D) Mean Q values for each of the treatments tested in A. (E) Mean τ values. (F) Slopes from the linear fits in D. ∗Indicates p < 0.05 by the Student's t-test. For extracellular additions, 1710–3956 spikes were recorded from 104–130 cells.