
Figure 5.
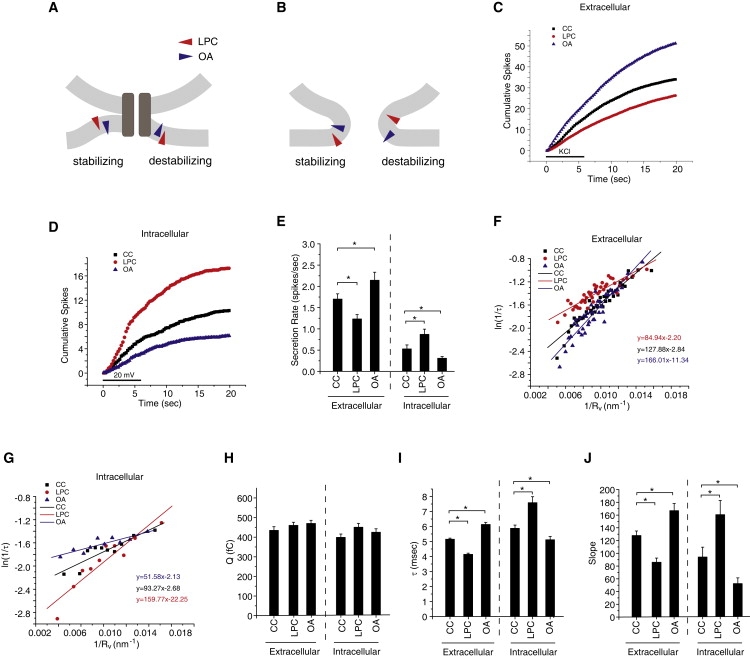
Membrane curvature and exocytosis. (A and B) Molecules with different effects on membrane curvature (colored triangles) stabilize or destabilize fusion pores depending on the side of the membrane. LPC (red) induces positive curvature by spreading the headgroups, and OA (blue) does the opposite. (A) For a proteinaceous pore, LPC induces curvature to favor a transition to a lipidic pore. OA at the same location induces curvature to oppose this transition. Presenting these molecules to the inside of a cell reverses their actions. (B) In a lipidic pore, LPC has a favorable interaction with the outside fusion pore membrane but an unfavorable interaction with the inside. OA has an unfavorable interaction with the outside but a favorable interaction with the inside. (C) Cumulative spike-count time course in control chromaffin cells and cells treated with 2 μM LPC, or 2 μM OA (added immediately before recording). The bar indicates depolarization with high KCl. (D) Cumulative spike-count time course in patch clamped chromaffin cells with control pipette solution and pipette solutions containing either 5 μM LPC or 5 μM OA. Note that patch clamping reduces secretion so control spike counts are lower in D than in B. (E) Secretion rates (spikes per cell in the first 20 s) from C and D. (F and G) ln(1/τ) versus 1/Rv plots in exocytosis. Q1/3 was converted to Rv using the scaling parameters obtained from fits in Fig. 3D. Best fitting lines were drawn and stated in the corresponding color. (H) Mean Q values for each of the treatments tested in C and D. (I) Mean τ values. (J) Slopes from the linear fits in F and G. ∗Denotes p < 0.05 by the Student's t-test. For extracellular additions, 1245–3956 spikes were recorded from 96–153 cells. For intracellular additions, 339–563 spikes were recorded from 24–25 patch-clamped cells.