
Figure 4.
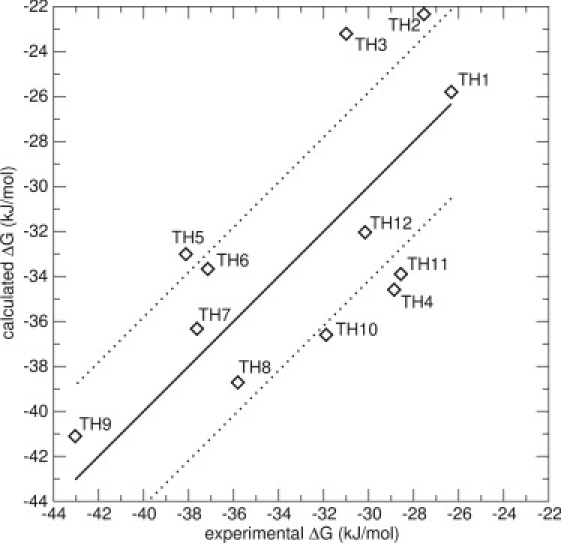
LIE Model 3 for the thiourea compounds, including energies from three simulations originating from one docked pose (N_1), but using different starting velocities. The thick line is not a correlation line, but indicates the perfect correlation between experimental and calculated values. The thin lines represent an error of ±4.19 kJ/mol (1 kcal/mol). The values are α = 0.54 and β = 0.28. The RMS error is 4.3 kJ/mol.