
Figure 5.
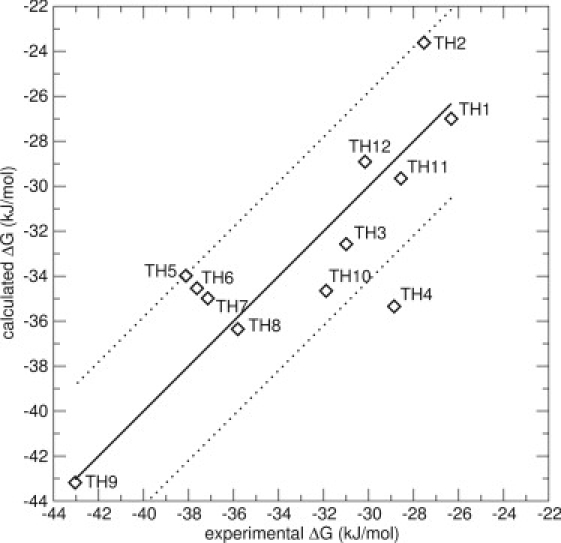
LIE Model 8 for the thiourea compounds, including energies from simulations of maximum six docked poses. The thick line is not a correlation line, but indicates the perfect correlation between experimental and calculated values. The thin lines represent an error of ±4.19 kJ/mol (1 kcal/mol). The values are α = 0.54 and β = 0.51. The RMS error is 2.9 kJ/mol. The only big outlier is compound TH4, with an error of 6.5 kJ/mol.