
Figure 4.
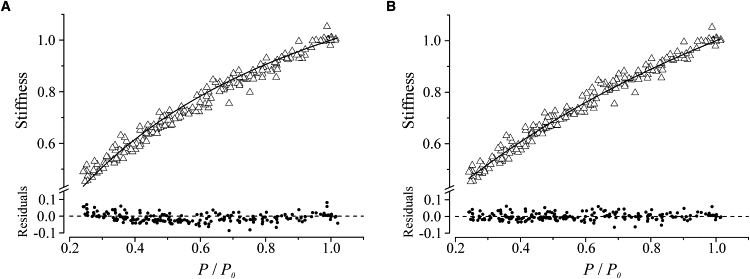
Stiffness-tension relation (open triangles) during submaximal tetanic contractions in the presence of 1 μM BTS and residuals (solid circles) of the best fitting (continuous line) of data with model 1 (A, see text) and model 2 (B, see text). Pooled data from eight fibers are shown. Both stiffness and tension are expressed relative to their plateau values in normal Ringer.