
Figure 4.
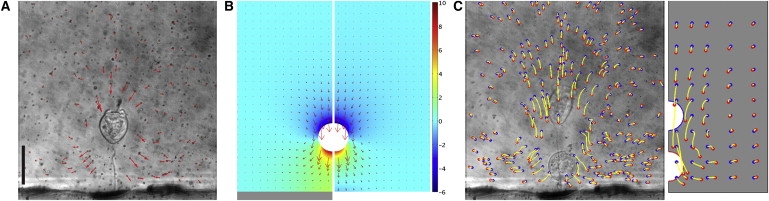
Water flow around contracting V. convallaria. (A) Experimentally visualized flow field at t = 0.74 ms, near τu,max. The scale of velocity vectors is arbitrary. Scale bar = 50 μm. (B) Flow velocity vectors (red arrows, arbitrary scale) with pressure distribution (Pa, colored fields) of corresponding CFD simulations for contraction in the presence (left panel) and absence (right panel) of the substrate (gray bar). (C) Particle trajectories around the same cell from the experiment (left panel) and CFD simulation (right panel). Yellow lines are particle paths, and blue and red dots indicate where particles start and stop, respectively. Images before and after contraction are overlapped. R = 19.1 μm, Remax = 2.3, Ls,max = 80.1 μm, Ls,min = 14.6 μm, c1 = 7.174 × 10⁻⁴ s, c2 = 1.257, and c3 = 1.086.