
Figure 3.
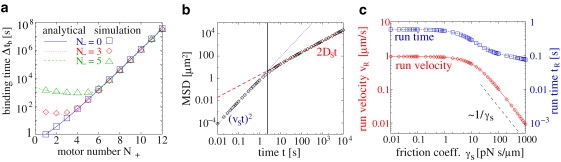
(Color) (a) The cargo binding time Δtb (symbols) increases with the numbers N+ of kinesins and N− of dyneins, and is well approximated by Eq. 3 (lines). Motor parameters are as in Table S1. (b and c) Symmetric tug-of-war of four plus and four minus motors with kinesin parameters as in Table S1. (b) The mean-square displacement MSD (points) increases with time t as (νSt)2 (blue dotted line) for small t and as 2DSt (red dashed line) for large t. The values for DS, νS, and the crossover time (vertical line) are given in the text. (c) The average run time tR (blue squares) and run velocity νR (red diamonds) decrease as a function of γs with a sharp reduction for γs ≃ 10 pNs/μm. For large γs, the run velocity decreases ∼1/γs as given by Eq. 5.