
Figure 4.
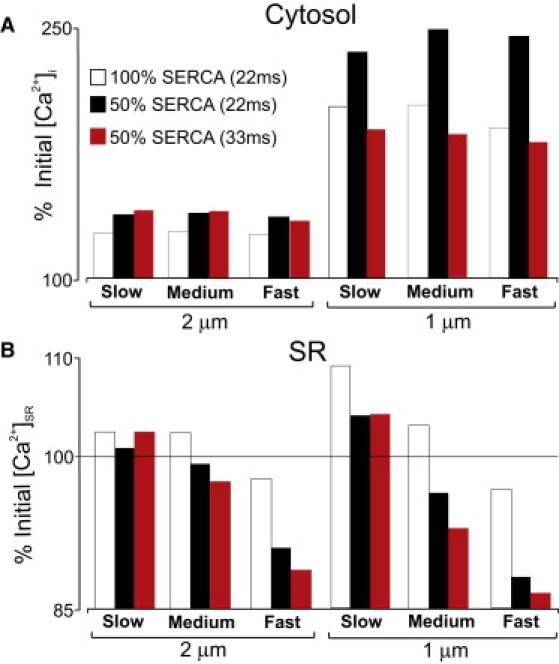
Effects of SERCA inhibition on [Ca2+]i (A) and [Ca2+]SR (B) at the target site. Bars show percentage changes in [Ca2+] with normal and partially blocked SERCA for different values of DCa,SR and different spacing between release sites.
Official websites use .gov
A
.gov website belongs to an official
government organization in the United States.
Secure .gov websites use HTTPS
A lock (
) or https:// means you've safely
connected to the .gov website. Share sensitive
information only on official, secure websites.
Effects of SERCA inhibition on [Ca2+]i (A) and [Ca2+]SR (B) at the target site. Bars show percentage changes in [Ca2+] with normal and partially blocked SERCA for different values of DCa,SR and different spacing between release sites.