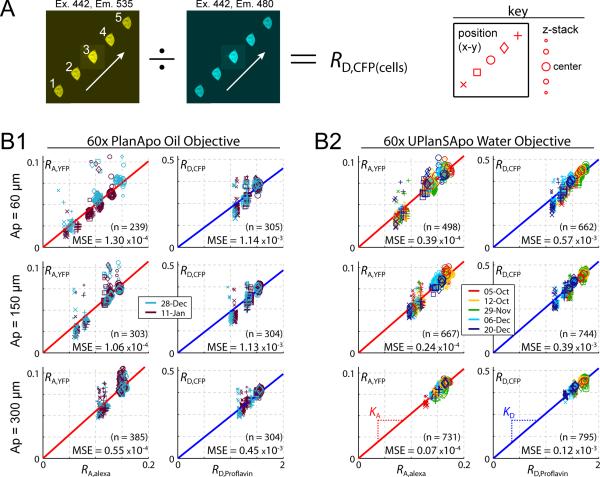
FIGURE 2.
Predicting RA,YFP and RD,CFP from RA,Alexa and RD,Proflavin. (A) Experimental protocol used to sample cell-based constants over the entire field of view. Each cell was moved to 5 locations across the x-y imaging field. At each location a z-stack of images was obtained. RD,CFP (example at left) or RA,YFP was calculated for each image from the ratio of ROI-averaged intensities of two channels. For each cell, this yielded values of RA,YFP or RD,CFP at five x-y locations, and at eleven z-positions (center position ± 10 μm, with 2 μm step size). The key (right) explains the conventions used in the scatter plots below. (B) Correlation between cell-based and dye-based ratios. Panel B1 uses an oil objective; panel B2 uses a water objective. The three rows correspond to pinhole apertures of 60, 150, and 300 μm from top to bottom. The size and shape of each data point follows the key convention shown on the far right of panel A, and the color corresponds to the date of the experiment (legends). Laser-fluctuation was normalized using Eq. 1 throughout. Number of data points (n) and mean square deviation from the best-fit line (MSE) are shown.

