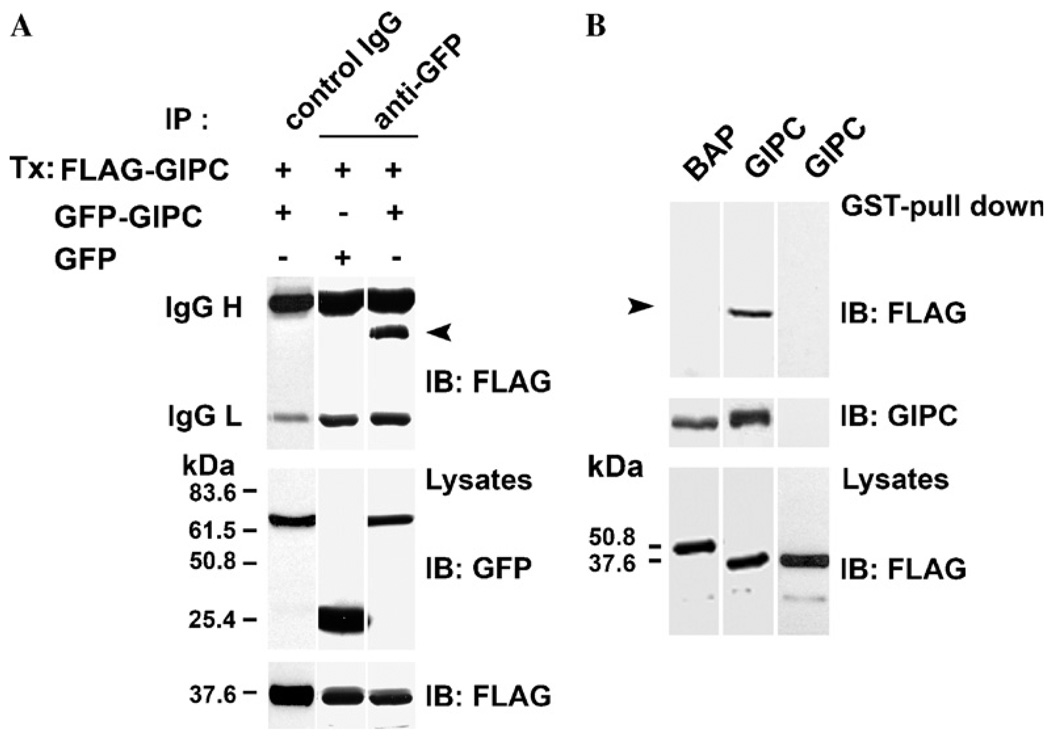
Fig. 1.
GIPC–GIPC interaction in vivo and in vitro-(A) SK-MEL-23.cl.22a (clone 22a) cells were transfected with 5 µg of either GFP–GIPC or GFP constructs together with FLAG–GIPC full length plasmids. Lysates were immunoprecipitated (IP) with anti-GFP mAb (top lanes 2 and 3) or control IgG (top lane 1) and analyzed by immunoblotting (IB) using anti-FLAG mAb M2 (top panel). Total lysates were probed with anti-GFP mAb (middle panel) and anti-FLAG mAb (bottom panel). Immunoglobulin heavy and light chains of mAb GFP/or of control IgG are indicated on the left. The positions of molecular mass markers (kDa) are shown. Arrow indicates the M2 reactive band. (B) Lysates of clone 22a cells transfected with FLAG–GIPC, FLAG-BAP, were incubated with GST–GIPC or GST–thioredoxin fusion proteins immobilized on GSH–Sepharose beads for 1 h. The bound proteins were eluted with thrombin and analyzed by SDS–PAGE and immunoblotted with mAb M2. GST-pull down analysis of lysates of melanoma cells transfected with FLAG–GIPC or FLAG–BAP and incubated with GST–GIPC fusion protein (top panel, lanes 1 and 2), transfected with FLAG–GIPC and incubated with GST–thioredoxin fusion protein (top panel, lane 3). The blot was reprobed with anti-GIPC Ab (middle panel). Total cell lysates were probed with anti-FLAG mAb M2 (bottom panel). Arrow indicates the M2 reactive band.

