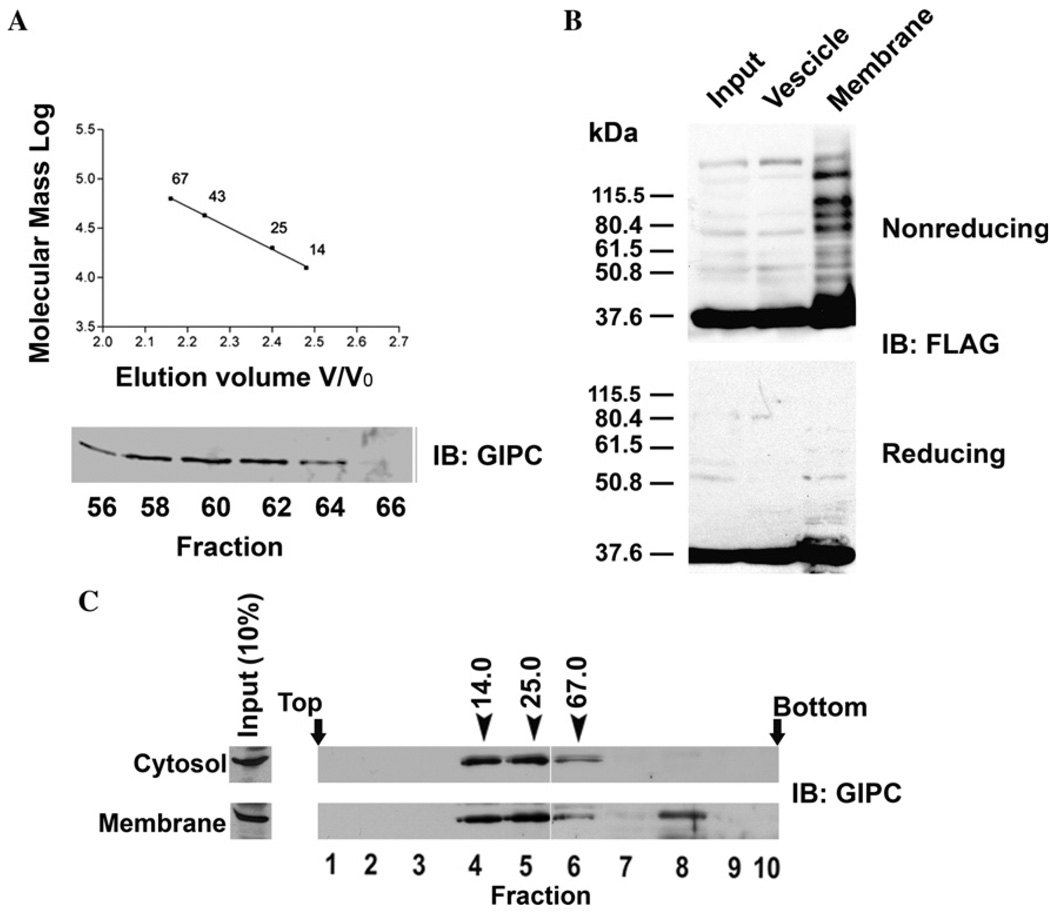
Fig. 4.
Subcellular distribution of GIPC oligomers. (A) Gel filtration chromatography was performed as detailed in the materials and methods with Sepharose 6B column (20 × 400 mm, 72 ml) which was calibrated with ribonuclease A (14 kDa), chymotrypsinogen A (25 kDa), ovalbumin (43 kDa) and albumin (67 kDa). Soluble protein fraction (1.5 ml) obtained from clone 22a cells was subjected to gel filtration, and the fractions collected were analyzed by SDS–PAGE followed by immunoblotting with anti-GIPC antibody. (B) Clone 22a cells transfected with FLAG-GIPC were harvested 40 h after transfection. Heavy membrane and light vesicle fractions were prepared as described in the methods, and were resolved by SDS–PAGE and probed with anti FLAG-mAb M2. (C) Clone 22a cells grown to 80% confluence were fractionated in to soluble protein and membrane fractions (see Materials and methods). The membrane associated proteins were eluted and soluble and membrane associated proteins were loaded on to a 8 to 40% (wt/vol) stepwise sucrose density gradient. After centrifugation for 24 h at 100,000g, 0.5 ml fractions were collected from the top and were analysed by SDS–PAGE and western blotting with anti-GIPC antibody. Fraction numbers are indicated below the immunoblot. Arrows indicate the positions of the marker proteins ribonuclease (14 kDa), chymotrypsinogen A (25 kDa) and albumin (67 kDa) processed on a gradient identically.

