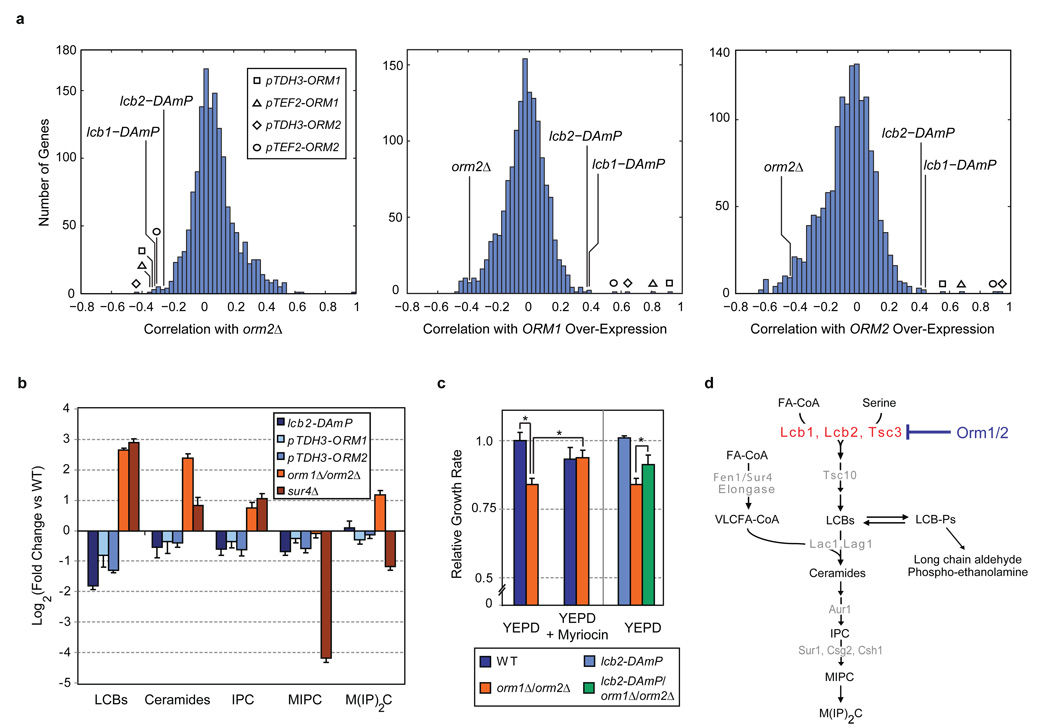
Figure 1. Orm1/2 are negative regulators of sphingolipid synthesis.
a, Genetic interaction (E-MAP) profiles were generated for strains harbouring ORM2 deletion, ORM1 over-expression, and ORM2 over-expression alleles (orm2Δ, pTDH3-ORM1 & pTEF2-ORM1, and pTDH3-ORM2 & pTEF2-ORM2, respectively). Correlations between the E-MAP profiles of these strains and those of >1400 other yeast mutants are shown in histograms (see Methods and Supplementary Data). b, Lipids were extracted from the indicated strains and analyzed using a global mass spectrometry approach30. Amounts of the indicated metabolites are shown relative to wild-type (WT; average ± s.d., n = 4; see Methods and Supplementary Data). c, Logarithmic-phase growth rates for the indicated strains were measured in standard media or media supplemented with myriocin at 150 ng/ml. Growth rates (average ± s.d., n ≥ 3) are shown normalized to wild-type (WT); asterisks denote statistical significance (p < 0.05). d, Schematic of the sphingolipid biosynthesis pathway in S. cerevisiae, with selected metabolites and genes indicated. Abbreviations are as follows: FA-CoA (fatty acid co-enzyme A), VLCFA-CoA (very long chain fatty acid co-enzyme A), LCBs (long chain bases), LCB-Ps (long chain base phosphates), IPC (inositolphosphorylceramide), MIPC (mannosyl-inositolphosphorylceramide), and MIP2C (mannosyl-diinositolphosphorylceramide).

