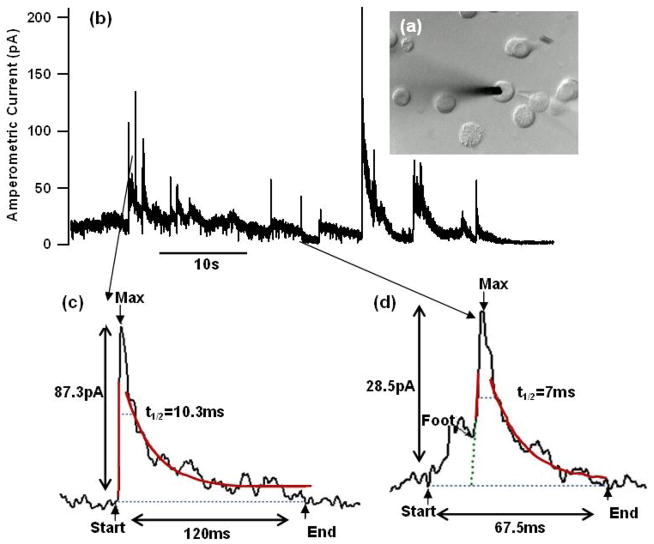
Fig. 5.
Amperometric recording of catecholamine release from a chromaffin celll using a CFE connected to the CMOS potentiostat. (a) Microscopic image of the CFE touching the cell and stimulation pipette containing 20 μM ionomycin positioned close to the cell. (b) Amperometric current after ionomycin stimulation. (c, d). Two events (smoothed) of varying amplitudes and half-widths on expanded scales with fit lines from the spike parameter analysis.

