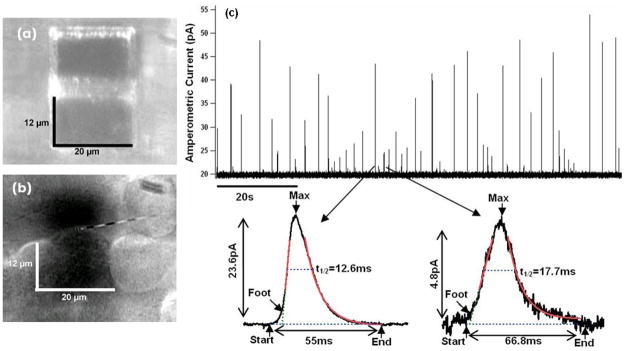
Fig. 7.
(a) Microscope image of on-chip Pt electrode dimensions. (b) Bovine chromaffin cells dropped onto the chip surface. The image was taken for demonstration purposes only and not during actual experimentation. Cells were released onto the electrodes and a water immersion objective focused on the cells. In the background electrodes can be seen as dark shadow. (c) Amperometric current trace showing spikes of variable amplitude up to ≈ 55 pA. Two events on expanded scales with fit lines from the spike parameter analysis.

