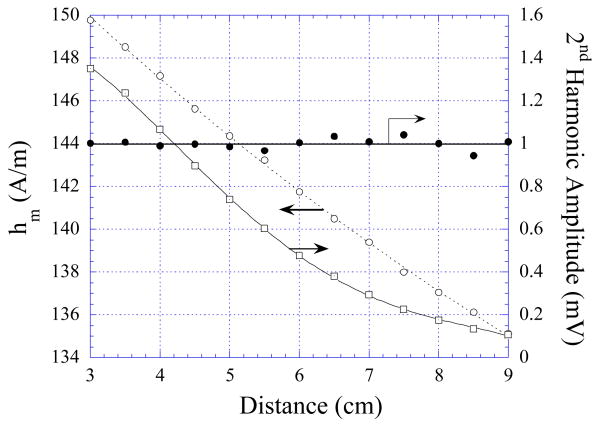
Fig. 9.
The change in Am (maximum 2nd order harmonic field amplitude) and hm (DC biasing field that corresponded to the maximum 2nd harmonic amplitude) of Sensor A was curve-fitted with the 3rd order and 2nd order polynomial curves, respectively. The ratio of the measured to calculate signal amplitude is also plotted.

