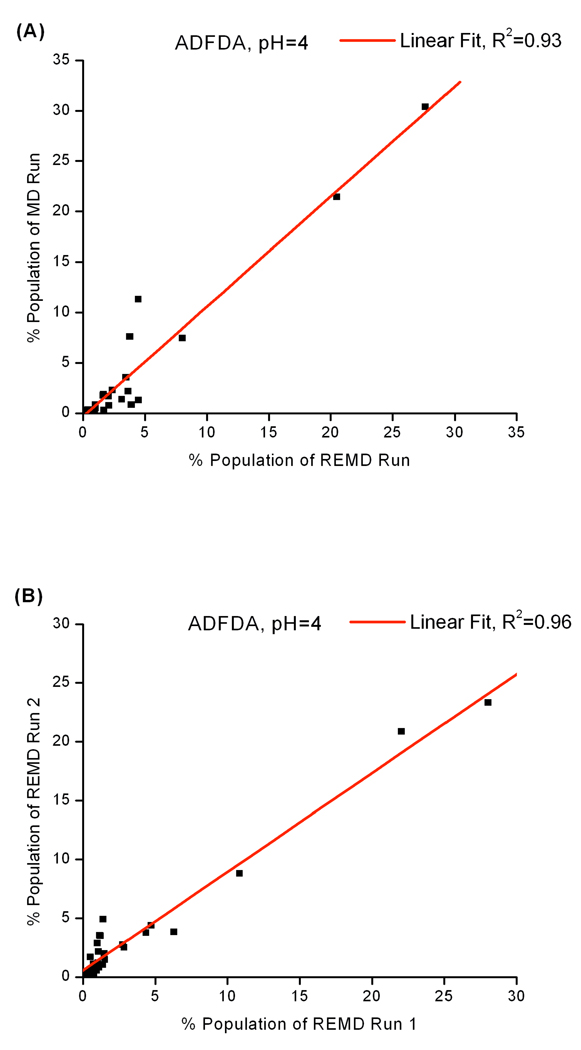
Figure 6.
Cluster populations of ADFDA at 300K (A): MD vs REMD at pH 4, (B): two REMD runs from different starting structures at pH 4. Large correlation shown in Figure 5B suggests that the REMD runs are converged. Large correlations between two independent REMD runs are also observed at other solution pH values. Correlations between MD and REMD simulations can be found in Table. 3.

