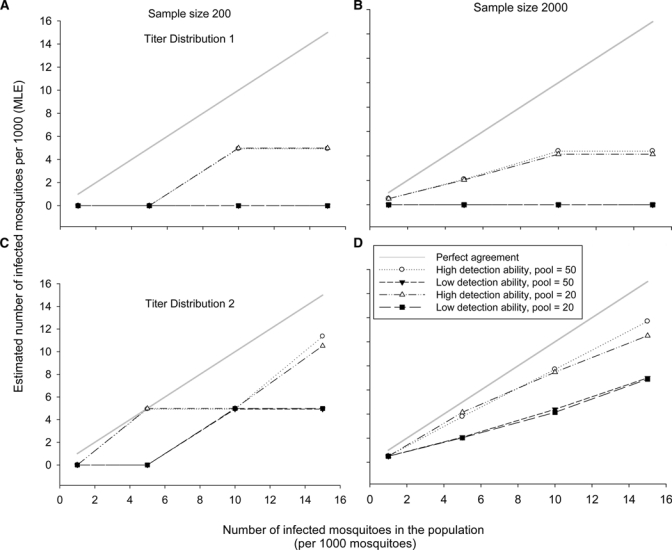
Figure 6.

Results of Model II showing the median outcomes of the estimated infection rate (maximum likelihood estimator [MLE]) frequency distributions (see Tables 2 and 3) obtained after simulated sampling and testing of mosquitoes coming from hypothetical populations with increasing infection prevalence (1, 5, 10, and 15 infected mosquitoes/1,000). Plots A and B correspond to median MLE outcomes for populations with viral titer Distribution 1. Because the estimation usually did not differ between different pool sizes, the lines are sometimes superimposed. Plots C and D correspond to median MLE outcomes for populations with viral titer Distribution 2. A gray solid line indicating perfect agreement between population prevalence and estimated infection rate is included for comparison purposes.
