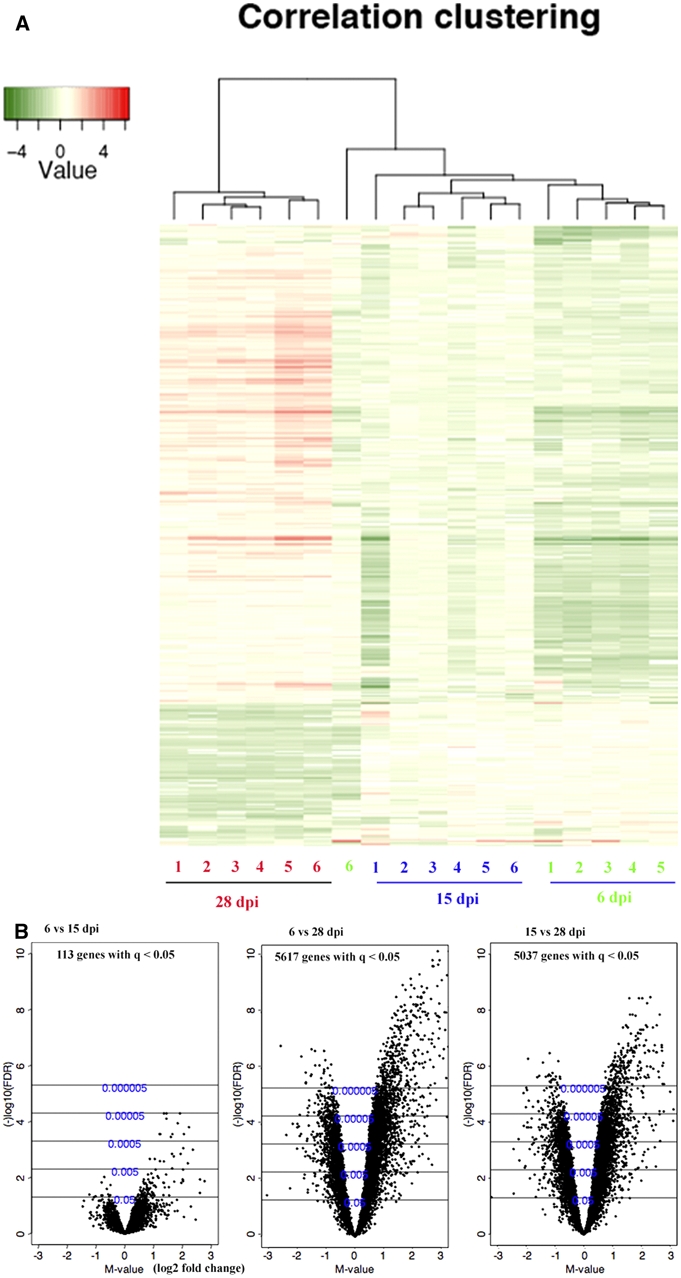
Figure 1.

Heat map and volcano plots of complementary DNA (cDNA) microarray analysis of differentially expressed genes in the brains of T. b. brucei-infected mice between 6, 15, and 28 days post infection (d.p.i.). (A) Heat map of varying genes with dendrograms of hierarchical clustering for replicates of mice brain samples obtained at 6, 15, and 28 d.p.i. (n = 6 per time point). Red represents a higher expression level, green means a lower expression level, and white means no difference in expression level. (B) Volcano plots of differentially expressed genes in the brains of T. b. brucei-infected mice between 6 and 15 or 28 d.p.i. and 15 and 28 d.p.i. The X axis shows log2 of the fold-change differences in gene expression (M-value) and the Y axis the Q-value in -log10 (false discovery rate, FDR) scale calculated by an empirical Bayes moderated t test. This figure appears in color at www.ajtmh.org.
