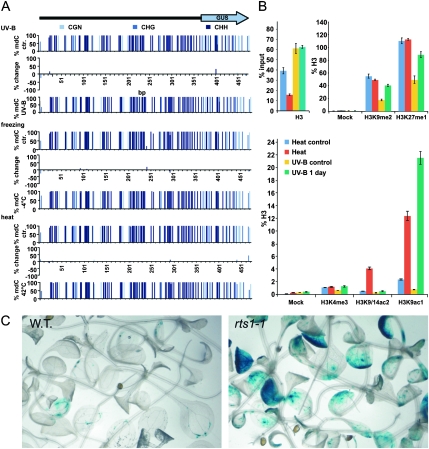
Figure 3.
Analysis of DNA Methylation and of the Chromatin Status at the TS–GUS Locus.
(A) Graphic representation of the DNA methylation of TS–GUS in response to UV-B and temperature stress. Ordinates correspond to percent methylation in the entire set of samples analyzed by bisulfite sequencing (n = 20). Differences between samples derived from control (top) and stressed (bottom) plants are indicated as bars (middle). Nucleotide positions are indicated at the x-axes.
(B) Chromatin immunoprecipitation performed with chromatin derived from UV-B, heat-stressed, and non-stressed control plants. Top left: histone H3 occupancy at the TS–GUS locus under ambient (control) and stressed conditions. Shown are values after normalization to the corresponding input fraction. Top right; bottom: histone H3 modifications at the TS–GUS locus under ambient (control) and stressed conditions. Values are normalized to control IPs performed with non-discriminating antibodies against histone H3. Standard deviations are indicated as bars.
(C) Comparison of TS–GUS activity in 14-day-old wild-type (WT, left) and rts1-1 (right) plantlets.

