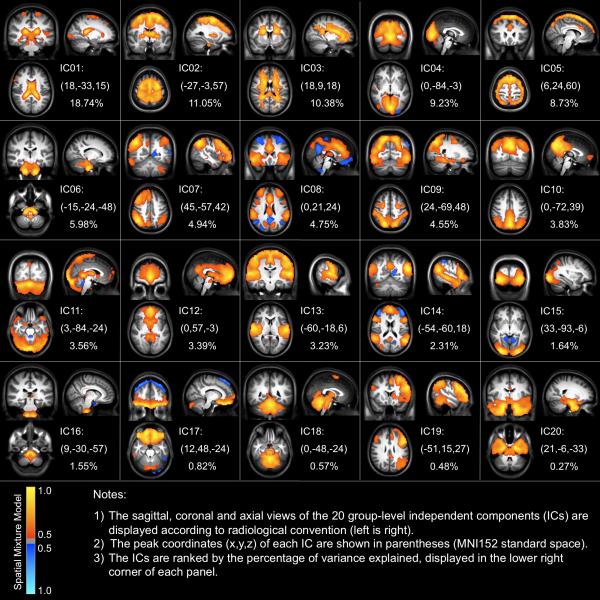
Figure 2. Group-level Components Revealed by the Temporal Concatenation Group Independent Component Analysis.
The saggital, coronal and axial views of the 20 group-level independent components (ICs) identified using TC-GICA are displayed according to radiological convention (left is right). The Z-statistic map relating to each IC is thresholded by a spatial mixture model (p > 0.5) and a cluster size (> 80 mm3). The peak coordinates (x, y, z) of each IC are shown in parentheses (MNI152 standard space).

