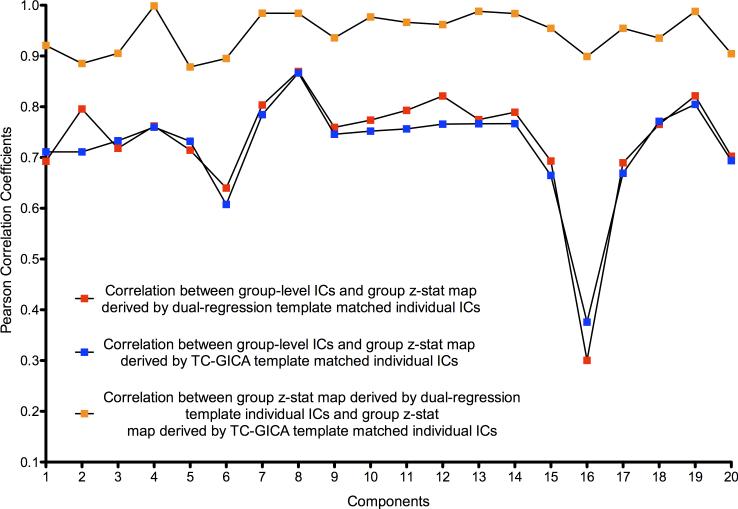
Figure 7. Consistency of Group-level Maps Based on Template Matching Results.
This figure demonstrates the consistency of template matching results from two different template strategies at the group-level: (1) the spatial correlation between a TC-GICA derived group-level component and a group z-statistic map derived by a random effect group analysis on individual dual-regression template-matched components (red squares), and (2) the spatial correlation between a group-level component and a group z-statistic map derived by a random effect group analysis on individual TC-GICA template-matched components (blue squares). Also shown is the spatial correlation between the two group z-statistic maps based on the individual components using the two template strategies (orange squares).

